How to Study Quick View in the Fynq Analytics Dashboard
Once Fynq is live on your Shopify store, it tracks how customers use your search bar, and filters in the background. The Quick View tab inside the Analytics dashboard is your fastest way to see how your store visitors or potential customers show their search behavior.
It’s called “Quick View” because it shows simple, high-level metrics at a glance. This brief section can tell you if your customers are finding what they need or struggling to locate the right products.
In this article, you as a merchant will understand each part of the Quick View screen, what it means, and how you can use the analytics to improve your store’s conversion.
Table of Content
- Where to Find the Quick View Panel
- What’s Included in Quick View?
- How to Use These Metrics to Improve Your Store
Where to Find the Quick View Panel
- Go to your Fynq AI Search & Filter app in your Shopify admin page
- Click on the Analytics tab in the left menu
- You’ll land directly on the Quick View dashboard
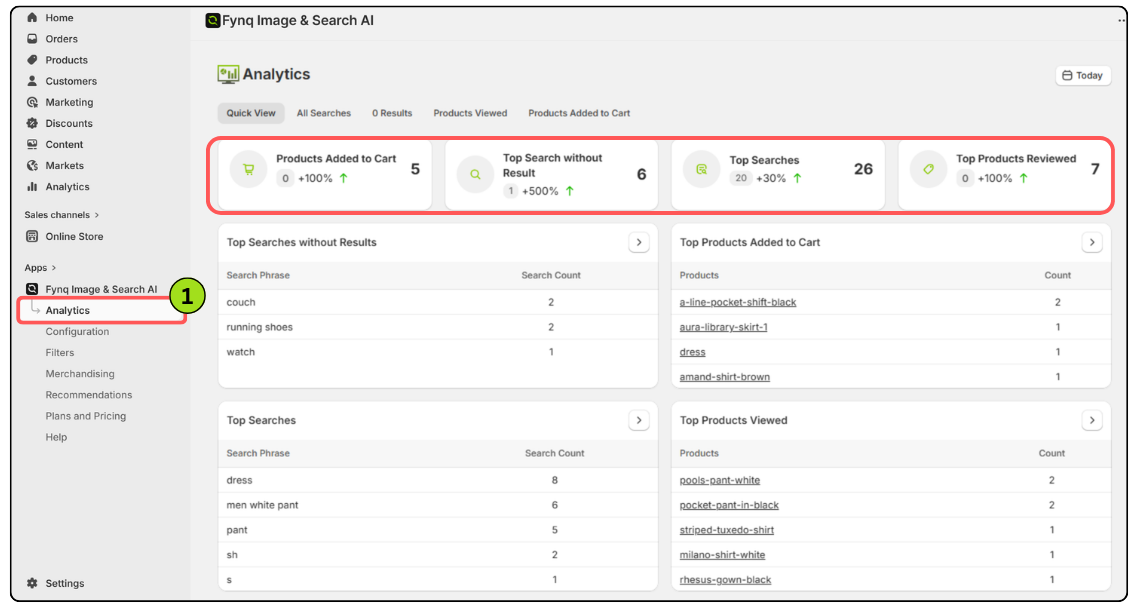
This is the first thing you’ll see a quick overview of real-time performance.
What’s Included in Quick View?
Each metric here represents a user’s action or experience tied to your store’s search and filtering.
Let’s break down each one:
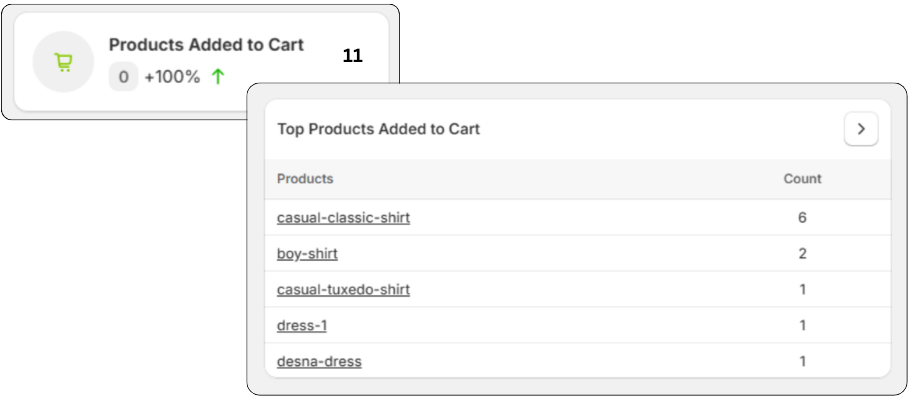
1. Products Added to Cart
This metric gives you proof of your successful entrepreneurship. This shows how many times products were added to cart after being found via Fynq’s search result page.
Why it matters:
This is a key conversion indicator. It tells you if people are not just finding products, but actually starting to buy them. Thus, you can manage your inventory – increase stock for those products which are added to cart frequently. On the other hand, if this metric shows a disappointing result (and a negative percentage with downward mark), it simply gives sign to work on your store authority by marketing or any other method.
Let’s see a use case of this metric: You notice that certain search terms lead to high views but no add-to-cart actions. You revise the product pricing or visuals, and conversions improve.
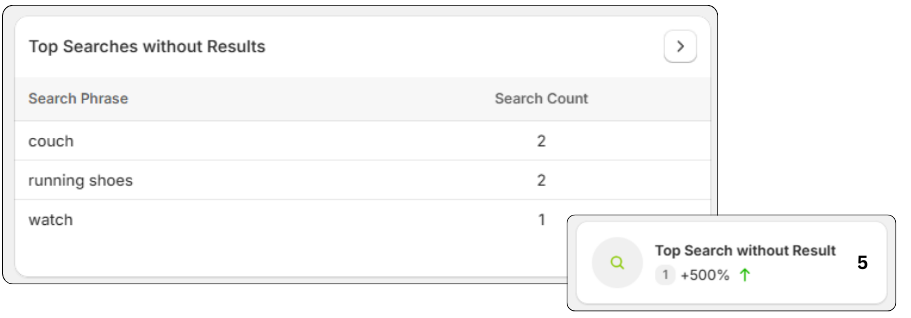
2. Searches without Result
These are searches that returned no product results to the visitors. Fynq tracks every instance where customers searched but didn’t find anything.
Why it matters:
Zero-result searches often mean lost sales. It could be due to missing product tags, poor naming, typos, or language mismatch. So, you as a merchant can work on rearranging your inventory, by adding products of those searches, by re-naming or by adding more details to the relative products.
Suppose you notice customers are searching for ‘sneakers’, but the store uses “trainers.” Adding a synonym in Fynq’s Text & Translation page resolves it immediately.
To learn more information about each tab, click here.
3. Total Searches
This shows the total number of search queries made on your storefront (while Fynq is active).
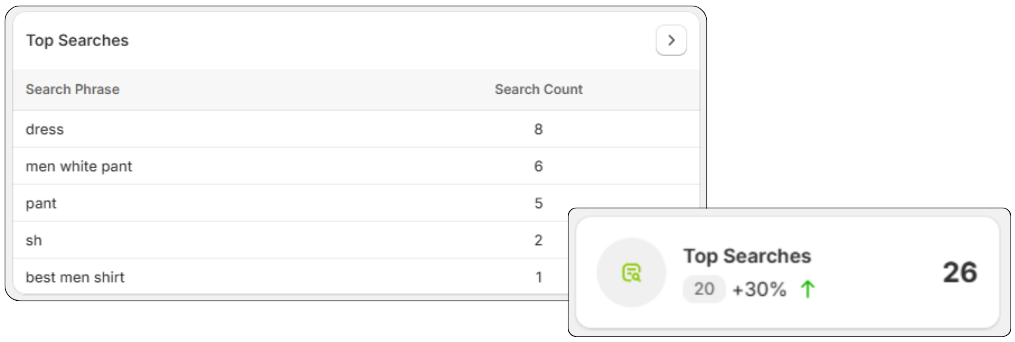
Why it matters:
If this number is low, your customers may not be using search at all. You might need to work on marketing your store and showing relevant products or collections on the popular pages of your site. So, these metrics help you to know the whole search behavior of your Shopify store.
4. Products Viewed
This metric is deeper than the above two. This tracks how many individual product pages (clicking on the product cards) were viewed after a search, showing that search is working and leading to exploration.
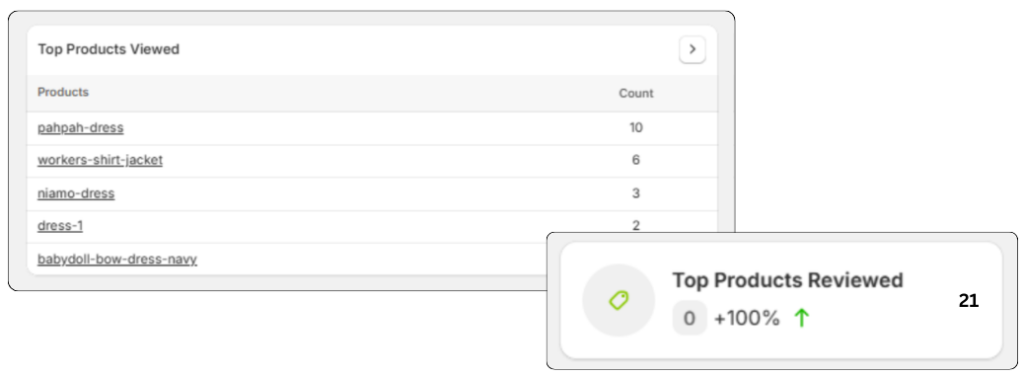
Why it matters:
If this number is high or gradually increasing, it means Fynq’s search is helping shoppers discover relevant items. If the number is less, you should work on rearranging your inventory or customize all the provided options in Fynq’s Personalization & Display Settings.
As a use case example, suppose you run a sale and suddenly product views jump after searching. This is proof that your updated filters and titles are working.
How to Use These Metrics to Improve Your Store
Fynq doesn’t just show numbers; it gives you the story behind how customers search.
Here’s how to act on the data:
| Metrics Signal | Your Steps to Take | |
| 1 | Low Search Count | Work on marketing your store & potential lead generation |
| 2 | High Zero Results | Add synonyms, fix product tags, expand keywords. Add products of those searches. |
| 3 | Low Product Views | Check if filters are too strict or search results are off. Rearrange your inventory. |
| 4 | Low Add-to-Cart Rates | Improve product descriptions, pricing, or availability. Work on your store authority. |
Data Comparison from Analytics
You can compare each data from the top-right corner. Find the option where there are ‘Today’, ‘Yesterday’, ‘Last 7 Days’, and so on. The best part of Fynq analytics lies here – besides the day’s search and conversion metrics, this feature will show how your store is performing compared to the last few days or weeks (as chosen).
Final Thoughts
Fynq’s Quick View dashboard may look small, but it tells you a lot about how well your Shopify store is performing in front of customers. You don’t need to be a data expert. Just check it weekly and look for big changes.
Even a slight increase in product views or add-to-cart actions can signal that your filters, synonyms, or layout are working better than before.
Use Quick View as your daily performance pulse, and you’ll always know how your search engine is really doing.